The growth of digital marketing has seen a surge in the use of data analytics tools to monitor and enhance online campaign performance. Google Data Studio is one adaptable and user-friendly tool that stands out in this landscape. This dynamic tool can pull data from various sources, including Facebook, providing comprehensive insights that elevate your marketing strategies.
Optimizing content for Facebook ads calls for a meticulous understanding of performance metrics. That’s where Google Data Studio swings into action by transforming these raw metrics into visually appealing reports that can help fine-tune your campaigns for optimal results. Whether you’re an experienced marketer or just dipping your toes into the world of digital marketing, learning how to use Google Data Studio could be a real game-changer in your Facebook Marketing strategy.
Explanation of Google Data Studio
Google Data Studio: A Comprehensive Reporting Solution
Google Data Studio is a revolutionary reporting tool that significantly augments data visualization and accessibility. This dynamic platform bridges the data collection and interpretation gap by offering interactive report formats. It amalgamates data from hundreds of sources, Facebook being one of them, thus simplifying your marketing analysis.
Compared with other reporting tools, Google Data Studio boasts unmatched customization options. You have complete autonomy to design your dashboard according to your preferences. Its ability to fetch real-time data facilitates well-informed decision-making, ensuring you get the most out of your Facebook marketing efforts.
Importance of Using Google Data Studio for Facebook Marketing
Successful Facebook marketing goes beyond merely creating and deploying appealing ads; constant monitoring, measuring, and adjusting campaigns based on data-driven insights are crucial for optimal performance. This is where Google Data Studio comes in as an indispensable tool. It enhances your ability to track metrics, analyze patterns, visually represent data-rich reports, and gain an edge over competitors by making informed decisions.
For instance, when using Facebook’s native analytics platform alone, you may lose yourself in overlapping data sets. However, Google Data Studio simplifies this by offering a clean visualization dashboard with customizable elements, allowing you to see the bigger picture clearly and instantly pinpoint any inconsistencies or opportunities. Unifying complex data into actionable insights has never been more effortless or effective than with Google Data Studio.
Getting Started with Google Data Studio
Stepping into the world of Google Data Studio is a game-changer for any Facebook marketer. Its intuitive interface and integration capabilities streamline your marketing data processes, enabling you to manipulate large data sets from Facebook Ads and transform them into visually stunning yet insightful reports.
No more manually shuffling between tabs or crunching numbers; Google Data Studio is the one-stop solution for your data needs. Whether you aim to track user demographic information or measure ad campaign performance over time, this tool lets you personalize reports according to your business objectives. So, let’s undertake this exciting journey and explore how we can leverage it effectively.
Creating an Account
To tap into the powerful analytics tool Google Data Studio, you must open a new account first. It’s simple and free. Head over to datastudio.google.com and use your existing Google credentials to sign in or create a new account if you don’t have one.
Creating an account is the foundational step before diving deeper into the realm of smart Facebook marketing reporting with Google Data Studio. As it seamlessly connects with other essential platforms like Google Analytics and Ads, you’ll find it incredibly versatile for syncing data from Facebook once your account is up and running!
Navigating the Interface
Google Data Studio’s interface presents an intuitive, user-friendly environment that simplifies data exploration and representation. Upon launching Google Data Studio, you’re met with a blank canvas where you can begin creating your interactive report. The toolbar at the top provides options for adding charts and graphs or inserting text boxes to customize your report. Along the screen’s right side are style and format settings used to personalize elements like color themes, fonts, or layout adjustments.
The ‘Pages’ panel on the looker’s left-hand side facilitates seamless navigation between different pages of your report if it contains multiple segments. With easy accessibility to content organization tools, such as grouping and ordering layers in reports, Google Data Studio provides a flexible design experience fitting for both beginners and experienced data analysts alike. Whether you need a simple pie chart or a complex geo map visualization – everything is systematically organized within reach in this resourceful platform.
Connecting Data Sources
One of the dynamic features of Google Data Studio is its ability to integrate smoothly with a myriad of data sources, including Facebook Ads. This eliminates manual number crunching or switching between separate analytics platforms. In essence, it provides a consolidated dashboard for all your data needs.
The connectivity process is straightforward: select ‘add data’ in Google Data Studio, navigate to ‘Facebook Ads’ as your source, and authenticate your account. You’ve now unlocked access to real-time insights from your Facebook marketing campaigns inside Google’s power-packed analytical tool. Not only does this save time, but it also instantly improves decision-making by providing accurate and comprehensive ad performance metrics.
Setting Up Facebook Data in Google Data Studio
Integrating Facebook data into Google Data Studio is straightforward, making it easily accessible for marketers and analysts. It begins with connecting the respective databases using a certified third-party connector such as Supermetrics, Two Minute Reports, Porter Metrics, Windsor.ai. These connectors serve as bridges, fetching data from Facebook and seamlessly integrating it into Google Data Studio for comprehensive analysis.
Supermetrics: This connector is known for its extensive data-fetching abilities. It allows users to import various metrics and dimensions from Facebook Ads, including campaign performance, audience data, and conversion metrics. Supermetrics stands out for its depth of data retrieval, making it ideal for detailed, data-heavy reporting.
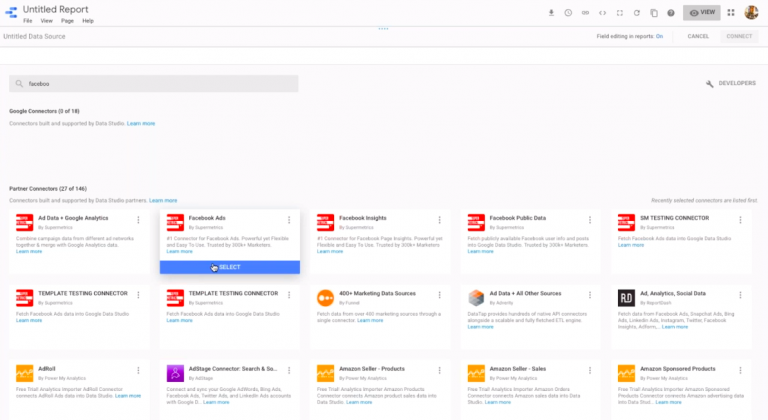
Two Minute Reports: As the name suggests, this tool emphasizes ease and speed in reporting. It offers a user-friendly way to connect Facebook data with Google Data Studio, focusing on efficiency and simplicity. It is ideal for those who need quick, regular updates without extensive customization and provides a straightforward solution for basic to moderate reporting needs.

Porter Metrics: This connector is user-centric, offering customized report templates alongside standard data integration. It allows users to import data from Facebook Ads and utilize pre-built templates that cater to common reporting needs, thus saving time and enhancing report consistency.

Windsor.ai: Windsor.ai focuses on multi-channel data integration, making it an excellent choice for marketers running campaigns across various platforms. Along with Facebook Ads data, it can integrate data from other marketing channels, offering a holistic view of digital marketing performance. This is especially beneficial for cross-channel optimization and analysis.

These connectors bring unique capabilities to the table, from detailed data retrieval and multi-channel integration to user-friendly interfaces and pre-built templates. The choice of connector largely depends on the user’s specific needs, such as the depth of data required, the level of customization needed, and the ease of use preferred.
Once connected, you can construct your reports by pulling specific metrics and dimensions from your Facebook Ads account to view in Google Data Studio. For instance, you may choose to track metrics like impressions, click-through rates, or conversions. The platform’s vast customization capabilities – you can design visual dashboards that best suit your analysis needs, giving you a visually engaging overview of your campaigns’ performance on Facebook.
Connecting Facebook Ads Manager
Linking your Facebook Ads Manager to Google Data Studio is arguably the first pivotal step in consolidating and interpreting your marketing data, providing a panoramic view of your campaigns’ effectiveness. This connection integrates both platforms seamlessly, allowing real-time updates on ongoing ad performances and interaction rates across specified periods.
Navigating through this set-up process might appear technical initially, but rest assured that it is streamlined for ease of use even by non-tech-savvy users. With a few user-friendly steps to connect these two solutions, businesses can efficiently inspect their paid social efforts alongside other data points, offering invaluable insights for better decision-making.
Selecting Relevant Metrics and Dimensions
In Facebook marketing, zeroing in on the appropriate metrics and dimensions is crucial for successful decision-making. Google Data Studio offers many choices; however, selecting random or too many can overload your reports and confuse you. It’s essential to align the selected metrics with your organization’s goals. For instance, if brand awareness is your core concern, metrics like reach, impressions, and frequency should top your list.
Further precision can be achieved by cherry-picking the dimensions that give context to these metrics: ad set name, campaign name, or placement could provide valuable insights into performance differences across various parameters. Leveraging targeted data selection will enhance clarity and transform Google Data Studio into a powerful ally in shaping data-driven Facebook marketing strategies.
Creating Custom Reports and Dashboards
Now that you’ve got your data in Google Data Studio, it’s time to turn this information into actionable insights using customized reports and dashboards. Customized reports translate raw numbers into organized visuals by inviting clarity through the complexities of your Facebook ad campaign data. Whether it’s deciding which creatives have the highest success rate or understanding fluctuations in click-through rates (CTR), these personalized reports will streamline decision-making.
The dashboard is another influential tool within Google Data Studio. As a central hub for all analytics, dashboards transform a sea of statistics into an intuitive display of charts and graphs that are easy to understand and track regularly. Particularly useful in monitoring trends over time, they provide marketers with meaningful performance snapshots at a glance – saving valuable time while boosting strategic effectiveness.
Tips for Using Google Data Studio for Facebook Marketing
One essential tip for leveraging Google Data Studio for your Facebook marketing is integrating it with Supermetrics, a tool designed specifically for pulling data from different platforms into Data Studio. Once you’ve connected your Facebook Ads account with Supermetrics, it becomes easier to visualize and analyze ad performance directly in the studio.
Another noteworthy tip involves utilizing the custom report features. Don’t limit yourself to the default reports; take advantage of Google Data Studio’s flexibility and adjust metrics based on your needs. For example, if you’re running a campaign with a particular focus on lead generation, you may want to gear your reports toward assessing conversions or demographic targeting efficiency. This lets you track crucial metrics that align perfectly with your Facebook marketing goals.
Utilizing Filters and Date Ranges
The seemingly daunting task of data interpretation through Google Data Studio can be distinctly simplified using filters and date ranges. Filters enable you to narrow down your data by specific parameters or categories. For example, if you’re looking at the demographics of your Facebook ad audience, filters can isolate data specific to age groups, geographical location, or device usage.
Date ranges power up your reports by providing time-based insights. Whether it’s a monthly breakdown or year-on-year comparison, setting accurate date ranges accurately depicts trends over time. Imagine tracking an ad’s performance over an essential period, for instance, during a seasonal sale – this level of detailed understanding can empower strategies for future campaigns.
Incorporating Calculated Fields
Understanding your numbers is crucial in making effective marketing decisions. With Google Data Studio, you can go beyond values and percentages by integrating calculated fields into your reports. For instance, instead of observing click-through rates (CTR) and impressions separately, you can create a new calculated field that combines both to show an ‘Effectiveness Score.’ This score could be computed based on criteria relevant to your campaign, such as CTR per 1000 impressions.
In Google Data Studio, building calculated fields is quite direct—use the CREATE NEW FIELD option under the Fields tab on a data source’s settings page. Remember to use appropriate functions for calculating ratios or aggregating data. By harnessing the power of calculated fields in this way, you gain deeper insights into your Facebook marketing campaigns and empower yourself with bespoke metrics that can guide more informed decision-making.
Using Templates for Quick and Easy Reporting
One of the key advantages of Google Data Studio is its selection of pre-designed templates, easing the reporting process significantly. These customizable templates serve as blueprints that can be tailored to display your Facebook marketing metrics in a manner that best suits your requirements. For example, you could select a template designed specifically for social media performance tracking, which will then be ready to plug in data from your Facebook marketing campaign.
Using templates eliminates the need to create reports from scratch, thus saving time while ensuring consistency in your reporting standards. Additionally, it reduces the possibility of misinterpretation by presenting data through well-structured visuals rather than complex spreadsheets and raw figures. Surely, this user-friendly approach to complex data manipulation contributes massively towards cutting labor hours while enhancing comprehension for all stakeholders involved.
Advanced Techniques for Data Visualization
One potent advanced technique in data visualization utilizes the blending feature in Google Data Studio. This powerful tool allows for merging multiple data sources, creating a more comprehensive view that enables you to identify patterns and trends that would be otherwise difficult to spot. For instance, this feature makes evaluating your Facebook ad performance across different demographics incredibly seamless.
Besides the blending feature, employing calculated fields provides even richer insights for your Facebook marketing endeavors. Calculated fields allow you to create personal equations on metrics from the dataset directly, blending existing figures and generating new ones. A classic example is calculating the cost per click (CPC) ratio against total engagements: an invaluable metric for marketers seeking efficient campaigns from their budget allocation.
Creating Interactive Charts and Graphs
Google Data Studio stands out among other reporting tools because of its user-friendly interface for generating interactive charts and graphs. This feature lets you visualize your Facebook ad metrics creatively, making complex data more understandable. For example, you may display the click-through rate (CTR) trends over time with a line graph or represent demographic data using a colorful pie chart.
Google Data Studio allows for customization in the type of chart or graph and the parameters set for each dimension. This means you can easily update your visualization based on different measures like age group, location, device type, etc. These interactive visualizations empower you to drill down into specific data segments, providing deeper insights into your Facebook marketing performance.
Incorporating Heat Maps and Geographic Data
In Facebook marketing, geographic data can deliver remarkable insights about your target audience’s behavior and engagement levels. Google Data Studio enhances this by offering tools such as heat maps that visualize these geographical distributions effectively. For instance, heat maps can illuminate regions where your ad impressions have been high or areas demonstrating intense user interaction with your content.
These generated visualizations then become essential guideposts for strategizing further marketing efforts. Consequently, if certain areas show low engagement compared to others on your map, it might re-evaluate targeting methods for those demographics. Harnessing the power of heat maps alongside geographical data helps facilitate more informed decisions chiefly connected with directing resources and refining promotional strategies accordingly.
Using Data Blending for Comprehensive Insights
Access to a detailed data analysis is crucial in any marketing strategy, but it’s even more beneficial when gathering insights from multiple sources. Google Data Studio’s data blending feature allows you to achieve exactly this – it lets you combine and juxtapose Facebook ads performance with other data sets.
For instance, by blending your Facebook ads metrics with website analytics from Google Analytics, you get a holistic view of the user journey, from ad clicks to on-site behavior. This integration offers an invaluable perspective – revealing how many people clicked your ad and what they did after arriving at your site. This information could be critical in shaping future advertising decisions and maximizing return on investment (ROI).
Best Practices for Facebook Marketing Reporting
Maximizing outcomes from your marketing efforts on Facebook begins with optimizing how you report and analyze performance data. In this regard, Google Data Studio offers interactive dashboards and customizable reports to help you make sense of complex data sets. It empowers you to collate multiple data sources, giving a unified view of your marketing performance across various campaigns.
One exemplary practice involves segregating your reporting based on specific key performance indicators (KPIs). For instance, if user engagement is a priority, focus your analysis on aspects like ‘Likes,’ shares, comments, or even time spent viewing videos. On the other hand, if lead generation or conversions are more crucial, the metric evaluation ought to revolve around click-through rates and conversions. The flexibility offered by Google Data Studio helps tailor these metrics according to individual campaign objectives.
Customizing Reports for Different Stakeholders
An impressive feature of Google Data Studio is its flexibility to customize reports based on the targeted audience. For instance, if you’re reporting to a C-Level executive, they might prefer an overview with key metrics such as return on advertising spend (ROAS), conversions, and click-through rates. Conversely, the marketing team would likely want to dive deeper into details like cost per click (CPC), ad impressions, and user demographics.
Moreover, visual representation plays a major role in effectively communicating these data points. A simpler pie chart may suffice for an executive summary, while trend lines or bar graphs might be ideal for showing campaign performance over time for your operations team. With Google Data Studio’s sophisticated array of customization options, crafting tailored reports that cater precisely to each stakeholder’s need becomes remarkably achievable.
Scheduling and Sharing Reports Automatically
If you’re looking to elevate efficiency in your marketing efforts, Google Data Studio’s automated report scheduling is an excellent tool you can’t afford to overlook. This feature allows you to set a custom schedule for auto-generating and sharing reports, thus saving significant time spent on tedious manual work. For example, your weekly performance evaluation reports can be programmed for automatic generation every Monday morning without fail.
Moreover, sharing these reports is as flexible as it’s seamless; you can send them directly via email or create shareable links accessible by the rest of your team. It’s a remarkable way to keep all stakeholders abreast of key metrics evolution in real-time while ensuring everyone is aligned with company objectives. By harnessing this functionality, productivity improvements are guaranteed, and better-informed decision-making becomes possible across the board.
Incorporating Annotations and Commentary for Context
A unique feature of Google Data Studio is its ability to incorporate annotations and commentary directly into the report. This adds another layer of context to your Facebook marketing data without complicating the layout or cluttering it with excessive text. For instance, if a sudden spike in engagement corresponds with a particular campaign launch date, you could annotate this on the graph and provide an additional explanation in an adjacent comment box.
Furthermore, using these features can help streamline your communication process. Instead of discussing significant findings separately through emails or meetings, all necessary insights and remarks are centralized within the report. Not only does this make information easier to understand for viewers unfamiliar with data analysis, but it also facilitates quicker decision-making based on that knowledge.
Troubleshooting and Common Issues
Like any software, Google Data Studio is a powerful tool with occasional quirks and difficulties. One common issue marketers face while using this platform for Facebook marketing pertains to data discrepancies between Google Data Studio and Facebook Ads Manager. This can happen due to different attribution models used by the two platforms or timezone differences.
In such situations, double-check your set-up process – ensure you’ve correctly linked the Facebook Ads account with Google Data Studio and compare metrics only from completed attribution windows in both sources. Sometimes, subtle adjustments can resolve the discrepancies, ensuring the accuracy of your analytics reports.
Dealing With Data Discrepancies
Data discrepancies can be a major hurdle in analyzing your Facebook marketing performance. However, Google Data Studio provides a powerful solution to this common issue. Its data blending feature allows you to combine and transform data from multiple sources, minimizing the chances of errors or inconsistencies.
Moreover, when confronted with irregular numbers generated by different reporting tools, it’s crucial to understand the methodologies used by these platforms for counting metrics. For instance, Facebook might register a ‘view’ based on its unique algorithms, which differ from Google Analytics’ understanding of the same metric. Keeping this perspective can help align your interpretation and reduce discrepancies using Google Data Studio.
Addressing Data Sampling Issues
Data sampling issues can significantly affect the quality of your Facebook marketing analyses. One of the key features that sets Google Data Studio apart is its robust approach to handling such challenges. Google’s powerful infrastructure ensures you work with unsampled data, providing an in-depth, accurate view of your metrics without sacrificing performance speeds.
Moreover, Google Data Studio supports many add-ons like Supermetrics that allow retrieving non-aggregated raw data from Facebook directly into your dashboard. For example, if you have a campaign featuring thousands of ad combinations, you can extract all necessary metrics without hitting Facebook’s API request limit. This ability gives marketers granular insights and prevents potential distortion from data sampling – making this tool invaluable for comprehensive analysis.
Resolving connectivity and data refresh problems
Understanding how to troubleshoot connectivity and data refresh issues in Google Data Studio can save you time and frustration. These problems typically arise when there is an interruption in the communication between Facebook and Google Data Studio or when your browser cache needs clearing.
To effectively mitigate these interruptions, you must familiarize yourself with the specific error messages. For instance, if Account configuration issues keep popping up, you must reauthenticate your account within Google Data Studio. On the other hand, regular data refreshing concerns might require revamping your Data freshness settings. No matter the problem, keeping an eye on new industry updates will equip you with innovative solutions for easily handling any minor hiccups along your Facebook marketing journey using Google Data Studio.
Conclusion
In Facebook marketing, Google Data Studio emerges as an exceedingly versatile and efficient tool. Its ability to curate, visualize, and share data in real time provides you with insights that can significantly improve your ad strategies on Facebook.
Whether you’re a seasoned marketer or just beginning your journey, leveraging Google Data Studio for your Facebook campaigns brings a higher level of analysis and understanding. This analytical edge can drive your advertising efforts toward success, making it worthy of exploration.
Beneficial Recap: Harnessing Google Data Studio for Facebook Marketing
The remarkable feature of Google Data Studio shines when you employ it to elevate your Facebook marketing. It’s a powerful tool that simplifies data collection and enables comprehensive analysis, fostering more informed decision-making. Take, for instance, Google Data Studio; you can streamline the process of consolidating metrics from various ads and campaigns on Facebook into a single dashboard. This level of integration is unmatchable and eliminates the need for manual compilation, saving significant time.
Further enhancing its utility, Google Data Studio displays these diverse metrics in visually pleasing and easy-to-interpret formats such as charts and graphs. The clear visualizations aid in identifying trends and patterns quicker, creating actionable insights towards your campaign performance optimization. These advantages collectively make Google Data Studio an indispensable asset in modernizing and improving your Facebook marketing strategy.
Encouragement to Explore and Experiment with Various Reporting Techniques
Data reporting is a dynamic field that demands creativity and constant exploration. Harnessing Google Data Studio for your Facebook marketing strategies requires an eager mindset to experiment with different techniques. For instance, you could merge multiple data sources into one comprehensive report or utilize calculated fields to create exceptional metrics.
The beauty of diverse reporting methods lies in each technique’s unique insights. For example, customized dashboards can illustrate real-time results, which enable prompt decision-making, while advanced filtering options give an in-depth analysis of targeted segments. Do not hesitate to employ various tactics simultaneously for an enriching perspective on your marketing performance.
Resources for Further Learning and Support
Variety, they say, is the spice of life; this couldn’t be more true when mastering Google Data Studio for Facebook marketing. The internet overflows with resource options you can access to deepen your understanding, with official tutorials by Google, blog posts from seasoned experts, video demonstrations on YouTube, and even dedicated online courses on platforms like Udemy or Coursera.
Don’t forget the invaluable knowledge exchange in community forums and discussion boards such as Google’s Help Community and Data Studio subreddit. These spaces allow direct interaction with other users who have tackled similar issues or implemented innovative strategies you could borrow. Exploring these resources gives you a breadth of perspective and firsthand user insights that complement the foundational learning materials that tutorials provide.

